Description
vRAN and vEPC rank among the most challenging use-cases of NFV, as they strike at the very core of cellular traffic engineering. There are multiple flavors of these technologies that range from scratching the surface at the upper network layers ranging to the radical approach of virtualizing the root layers themselves.
Highlights
This report will take stock of the past, make sense of the present and forecast the future of these technologies. It will answer the following queries:
- How complex are vRAN and vEPC?
- What is their market size?
- How inevitable are vRAN and vEPC?
- What do telcos think about vRAN and vEPC?
- What is the approach of the existing hardware vendors towards vRAN and vEPC?
Table of Contents
1 Executive Summary
2 NFV and SDN
2.1 Introduction to NFV
2.2 Role played by European Telecommunications Standards Institute (ETSI)
2.2.1 Other noteworthy contributors
2.3 NFV architecture
2.3.1 VNFi/NFVi
2.3.2 Managing NFVi Performance
2.3.2.1 Offloading
2.3.3 Hypervisors – vSphere, KVM and others
2.3.4 DPDK – Accelerating the processors
2.3.5 Fast Data Input / Output (FD.io) – an Able Ally for DPDK
2.3.6 Containers – Contrarians to VMs
2.3.7 VNFs
2.3.8 MANO
2.3.8.1 Virtualized Infrastructure Manager (VIM)
2.3.8.1.1 Kubernetes
2.3.8.2 VNF Manager (VNFM)
2.3.8.3 NFV Orchestrator (NFVO)
2.3.8.4 Open Network Application Platform (ONAP)
2.3.8.4.1 Backstory of Open-O
2.3.8.4.2 Backstory of ECOMP
2.3.8.5 Lifecycle Services Orchestrator – The contrarian MANO
2.3.9 Parallels with server virtualization
2.4 Introduction to SDN
2.5 SDN Architecture
2.5.1 Application layer
2.5.2 Control Layer
2.5.3 Infrastructure Layer
2.6 SDN interfaces
2.6.1 Northbound interfaces
2.6.2 Southbound interfaces
2.7 SDN Use-cases
2.8 SDN Use-Case: CORD
2.9 SDN Use-Case: Service Delivery/Fulfilment, excluding BoD
2.1 SDN Use-Case: NaaS/ BoD
2.11 SDN Use-Case: Mobile Network Virtualization/ Network slicing
2.12 SDN Use-Case: SD-WAN
2.13 SDN Use-Case: Service function chaining
3 EPC and its Virtualization
3.1 Contours of EPC
3.1.1 SAE and the Flat Architecture
3.1.2 Decoupling of Planes
3.1.3 NAS
3.2 Blocks in the EPC
3.2.1 SGW
3.2.2 PGW
3.2.3 ePDG
3.2.4 TWAG
3.2.5 MME
3.2.6 HSS
3.2.7 Other optional elements
3.3 The vEPC Dynamic
3.3.1 Prelude to vEPC – Mounting Challenges for the EPC
3.3.2 vEPC – The Remedy
3.3.3 The Mechanics of vEPC
3.3.4 Challenges Confronting vEPC
3.4 Vendor Approaches
3.4.1 Affirmed Networks Mobile Content Cloud (MCC)
3.4.2 Athonet vEPC and BubbleCloud
3.4.3 Cisco Ultra Packet Core
3.4.4 Core Network Dynamics (CND) OpenEPC
3.4.5 Ericsson Cloud Packet Core
3.4.6 Huawei CloudEPC
3.4.7 Mavenir vEPC
3.4.8 NEC/Netcracker vEPC
3.4.9 Nokia Cloud Packet Core
3.4.9.1 CMM
3.4.9.2 CMG
3.4.10 ZTE vEPC
3.4.11 Telrad Solutions BreezeWAY
4 RAN and its Virtualization
4.1 Evolution of the RAN
4.1.1 GRAN or GERAN
4.1.2 UTRAN
4.1.3 E-UTRAN
4.2 5G-The Game Changer
4.3 The Progression of the RAN to the vRAN
4.4 CPRI, DAS and vRAN
4.5 RAN Virtualization – A Story of Alliances
4.5.1 xRAN Forum and ORAN Alliance
4.5.2 Open vRAN
4.5.3 Telecom Infra Project (TIP) OpenRAN
4.6 Vendor Approaches
4.6.1 Altiostar vRAN
4.6.2 Airspan AirSymphony
4.6.3 Amarisoft eNodeB
4.6.4 ASOCS Cyrus
4.6.5 Commscope OneCell LTE Controller
4.6.6 Dali Matrix vFI
4.6.7 Nokia AirScale
4.6.8 Parallel Wireless Hetnet Gateway
4.6.9 Phluido 4.9G vRAN
5 Solution Provider Profiles
5.1 Organization Categories
5.1.1 Domain Experts
5.1.2 DAS Specialists
5.1.3 Equipment Vendors
5.1.4 Independent Software Vendors
5.1.5 Semiconductor Specialists
5.1.6 OS and Firmware Specialists
5.1.7 Niche solution developers
5.2 Company Profiles
5.3 6WIND
5.3.1 6WINDGate
5.4 Affirmed Networks
5.4.1 Mobile Content Cloud (MCC)
5.4.2 Virtual Slice Selection Function (vSSF)
5.5 Airspan
5.5.1 AirSymphony
5.6 Altiostar
5.6.1 Altiostar vRAN
5.7 Amarisoft
5.7.1 eNodeB
5.8 Amdocs
5.8.1 Network Cloud Service Orchestrator (NSCO)
5.9 ASOCS
5.9.1 Cyrus
5.1 Athonet
5.10.1 vEPC Platform and BubbleCloud
5.11 Baicells
5.11.1 vEPC
5.12 Cirrus Core Networks (CCN)
5.12.1 vEPC
5.13 Cisco Systems
5.13.1 Ultra Packet Core
5.14 Cobham Wireless
5.14.1 idDAS
5.15 Commscope
5.15.1 OneCell
5.16 Core Network Dynamics (CND)
5.16.1 OpenEPC
5.17 Dali Wireless
5.17.1 Matrix
5.18 Dell EMC
5.18.1 Open Networking Switches
5.19 Ericsson
5.19.1 vRAN
5.19.2 Cloud Packet Core
5.19.3 CENX 7 LSO
5.2 Huawei
5.20.1 CloudEPC
5.21 Intel
5.21.1 Open Network Platform Server
5.22 JMA Wireless
5.22.1 XRAN Adaptive Baseband Software
5.23 Mavenir
5.23.1 vEPC
5.23.2 xRAN Controller
5.24 NEC/Netcracker
5.24.1 Proposed VNF – Cloud RAN (C-RAN):
5.24.2 vEPC
5.25 Netronome
5.25.1 Agilio SmartNICs
5.26 Nokia
5.26.1 Cloud Packet Core
5.26.2 AirScale
5.27 Oracle
5.27.1 Communications Network Service Orchestration Solution
5.28 Radisys
5.28.1 Cloud-based NFVi
5.28.2 MediaEngine
5.29 Parallel Wireless
5.29.1 Hetnet Gateway
5.29.2 Converged Wireless System
5.3 Phluido
5.30.1 4.9G vRAN
5.31 Quortus
5.31.1 ECX Core
5.32 Red Hat
5.32.1 Red Hat OpenStack
5.33 Samsung
5.33.1.1 Samsung AdaptiV
5.34 SOLiD
5.34.1 Genesis
5.35 Telrad Networks
5.35.1 BreezeWAY
5.36 VMware
5.36.1 NFV Framework
5.37 Wind River
5.37.1.1 Titanium Cloud Product Portfolio
5.38 ZTE
5.38.1 vEPC
6 Telco Profiles
6.1 Overview of telco approaches
6.2 Telco profiles
6.3 Airtel
6.3.1 vEPC and vRAN initiatives
6.4 AT&T
6.4.1 vEPC and vRAN initiatives
6.5 BT
6.5.1 vEPC and vRAN initiatives
6.6 China Mobile
6.6.1 vEPC and vRAN initiatives
6.7 China Telecom
6.7.1 vEPC and vRAN initiatives
6.8 China Unicom
6.8.1 vEPC and vRAN initiatives
6.9 Deutsche Telekom
6.9.1 vEPC and vRAN initiatives
6.1 Etisalat
6.10.1 vEPC and vRAN initiatives
6.11 Jio
6.11.1 vEPC and vRAN initiatives
6.12 KDDI
6.12.1 vEPC and vRAN initiatives
6.12.2 Analysis
6.13 KT
6.13.1 vEPC and vRAN initiatives
6.14 LG Uplus
6.14.1 vEPC and vRAN initiatives
6.15 Lifecell Ukraine
6.15.1 vEPC and vRAN initiatives
6.16 M1 Singapore
6.16.1 vEPC and vRAN initiatives
6.17 NTT Docomo
6.17.1 vEPC and vRAN initiatives
6.18 Ooredoo
6.18.1 vEPC and vRAN initiatives
6.19 Optus (Singtel Optus)
6.19.1 vEPC and vRAN initiatives
6.2 Orange
6.20.1 vEPC and vRAN initiatives
6.21 Saudi Telecom
6.21.1 vEPC and vRAN initiatives
6.22 Singtel
6.22.1 vEPC and vRAN initiatives
6.23 SK Telecom
6.23.1 vEPC and vRAN initiatives
6.24 Softbank
6.24.1 vEPC and vRAN initiatives
6.25 Sprint Corporation
6.25.1 vEPC and vRAN initiatives
6.26 Swisscom
6.26.1 vEPC and vRAN initiatives
6.27 T-Mobile
6.27.1 vEPC and vRAN initiatives
6.28 Telecom Italia
6.28.1 vEPC and vRAN initiatives
6.29 Telefonica
6.29.1 vEPC and vRAN initiatives
6.3 Telia
6.30.1 vEPC and vRAN initiatives
6.31 Telkom Indonesia
6.31.1 vEPC and vRAN initiatives
6.32 Telstra
6.32.1 vEPC and vRAN initiatives
6.33 Turk Telecom
6.33.1 vEPC and vRAN initiatives
6.33.2 Analysis
6.34 Turkcell
6.34.1 vEPC and vRAN initiatives
6.35 Veon VimpelCom
6.35.1 vEPC and vRAN initiatives
6.36 Verizon
6.36.1 vEPC and vRAN initiatives
6.37 Vodafone
6.37.1 vEPC and vRAN initiatives
7 Quantitative Forecasts
7.1 Research Methodology
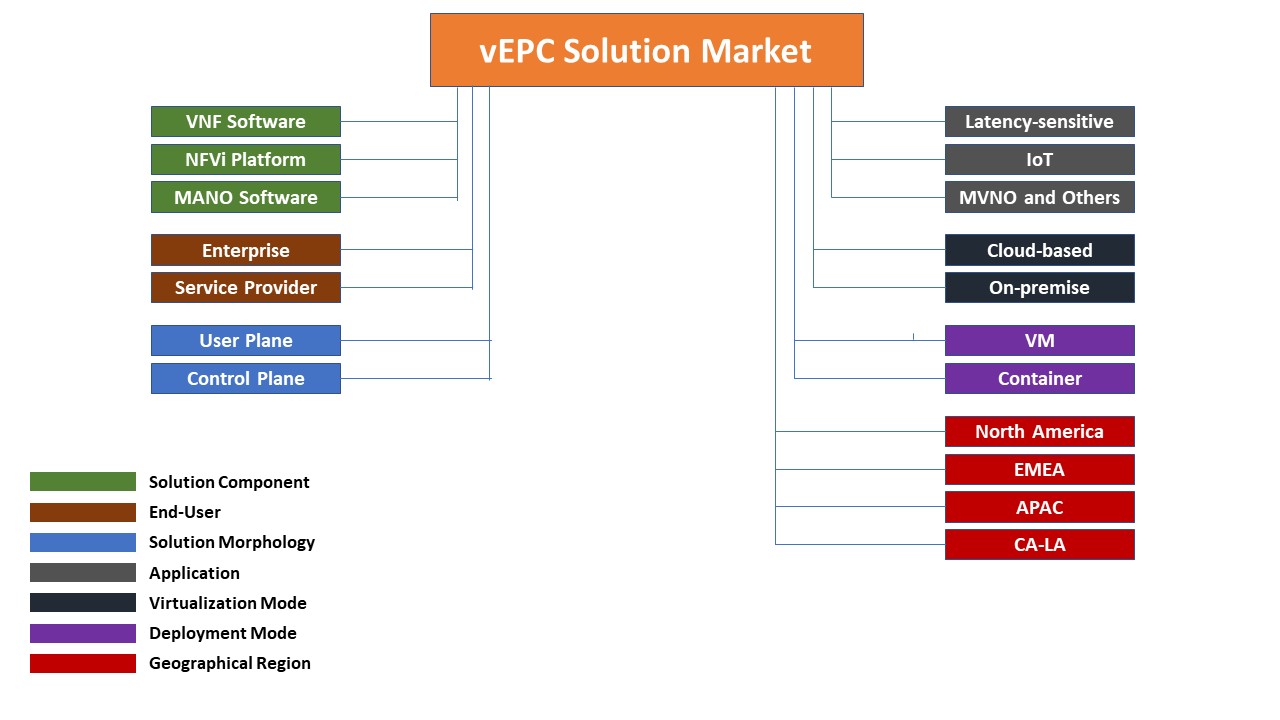
7.2 The vEPC Market
7.2.1 Breakdown by Solution Component
7.2.2 Breakdown by User Segment
7.2.3 Breakdown by Solution Morphology
7.2.4 Breakdown by Application
7.2.5 Breakdown by Virtualization Mode
7.2.6 Breakdown by Deployment Mode
7.2.7 Breakdown by Region
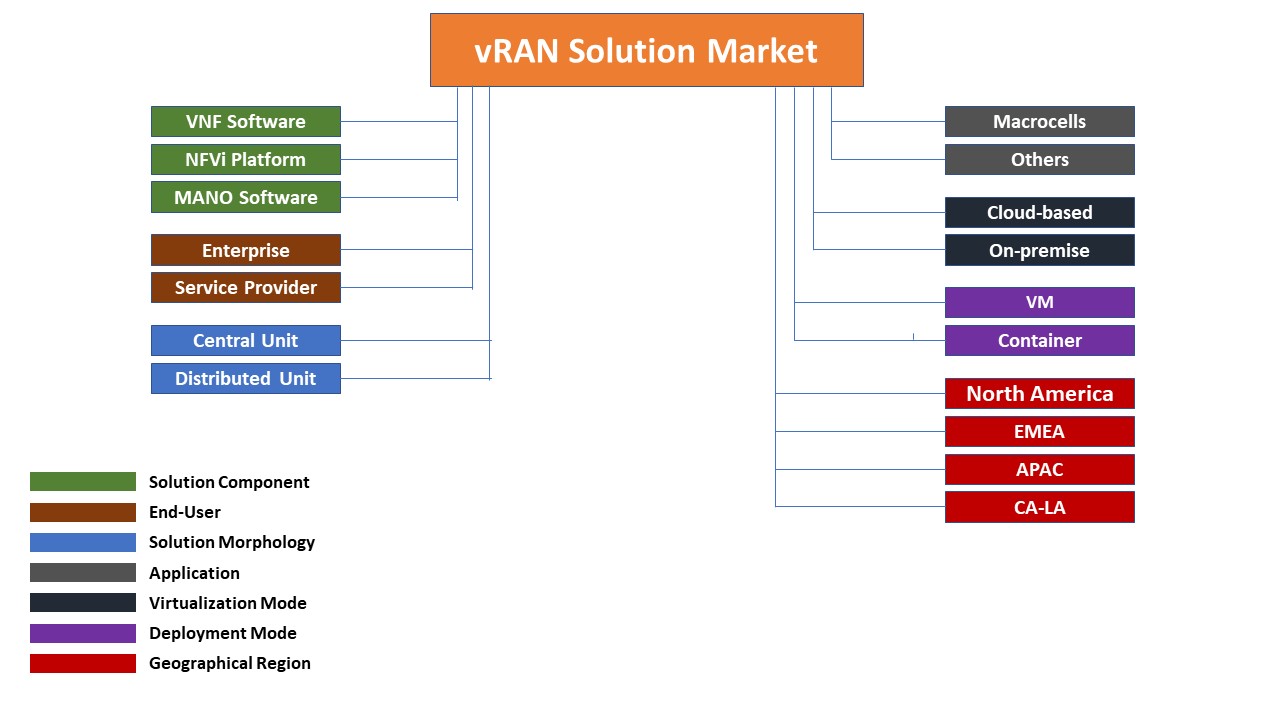
7.3 The vRAN Market
7.3.1 Breakdown by Solution Component
7.3.2 Breakdown by User Segment
7.3.3 Breakdown by Solution Morphology
7.3.4 Breakdown by Application
7.3.5 Breakdown by Virtualization Mode
7.3.6 Breakdown by Deployment Mode
7.3.7 Breakdown by Region
8 Glossary and Acronyms
